
Mastering the Job Interview Process: A Guide for Data Science and Analytics Students 

screen shot of interview app

The most nerve-racking part of securing a job offer is the job interview process. After spending an entire year mastering technical concepts, building projects, and gaining hands-on experience, it all culminates in the crucial moments sitting across from potential employers. Whether you are applying for full-time roles or rotational programs, Continue reading Mastering the Job Interview Process: A Guide for Data Science and Analytics Students 

Creating a Custom ggplot2 Theme 

scatterplot

Nearly every data scientist will say the same thing: The most important aspect of analytics is effectively communicating your results. So, how can you do this, whether it be in your practicum project, personal work, or career? The key is to make beautiful and easy-to-interpret visuals.  The ggplot2 package in Continue reading Creating a Custom ggplot2 Theme 

Ggeconodist: Your Secret Weapon for Graphing
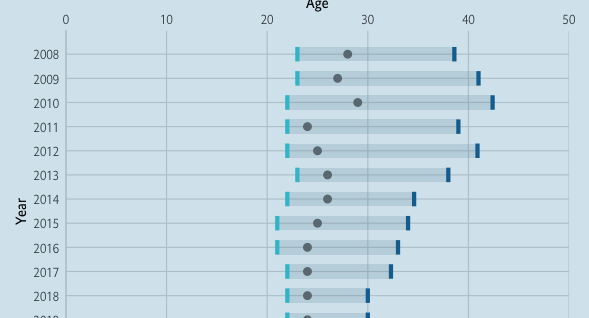
The  ggplot2 library is an incredibly powerful and wonderful visualization tool for most graphs, but when it comes to boxplots, the ggeconodist library has the upper hand. Learning to use this library in R means you will no longer spend 10 minutes explaining your boxplot to your audience. Both boxplots Continue reading Ggeconodist: Your Secret Weapon for Graphing
Learning SAS With Baseball Data, Where Process > Results

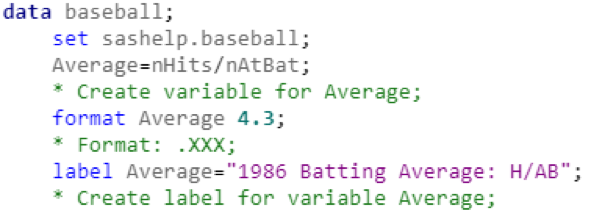
Last Monday marked the beginning of the “bootcamp” portion of the MSA program. Aside from two communications classes and preparing for a group presentation, the first week of bootcamp mainly consisted of learning and applying statistical concepts and the SAS programming language. As a member of the orange summer cohort, Continue reading Learning SAS With Baseball Data, Where Process > Results