Tips to Survive the Summer Semester

If there is one thing every new student at the Institute for Advanced Analytics can expect upon arrival for their summer semester, it’s to hit the ground running. When we received details about our first group project before the first day of orientation had even ended, I felt entirely overwhelmed. Continue reading Tips to Survive the Summer Semester

Managing Notes with Ease

One of the aspects of being a part of the MSA cohort is getting accustomed to the pace that the subjects are covered. The curriculum is as intense as it is interesting, thanks to the numerous topics covered throughout the Summer, Fall, and Spring semesters.  Taking notes effectively during class Continue reading Managing Notes with Ease

A Guide to Colorblind-Friendly Visualizations

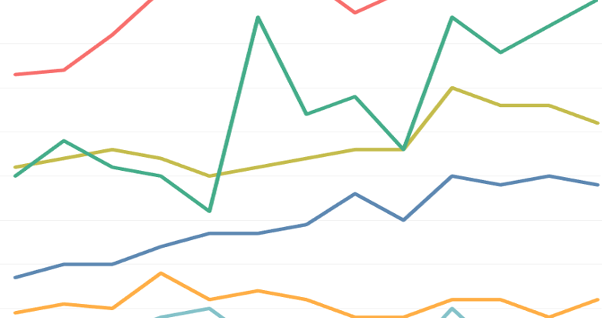
multicolored line graph

At the Institute for Advanced Analytics, we spend a lot of time honing our communication skills. This surprised me at first. Coming from a background in statistics, I had always spent more time thinking about the tests I was running or the models I was building than the presentation of Continue reading A Guide to Colorblind-Friendly Visualizations

Using Tableau to Build a Time Series Model

Tableau is most often used as a visualization tool, but it is also a powerful tool to build exponential smoothing models for time series data. If your data uses an exponential smoothing model for forecasting (more recent observations are given greater weight), and you want to have a quick drag-n-drop Continue reading Using Tableau to Build a Time Series Model