The Right Amount of Wrong: Calibrating Predictive Models
How do we evaluate a predictive model? The most intuitive answer is accuracy—a simple measure of what percent of the time your model’s prediction is correct. Accuracy is a widely used evaluation metric, largely because it’s so easy to understand. However, a fixation on accuracy can obscure some of the important characteristics of a predictive model.
Calibration is a useful tool that can help compensate for accuracy’s shortcomings.
To illustrate the value of model calibration, we’ll turn to one of the most challenging prediction problems: NCAA football.
The Sport
If you’ll indulge me, I’d like to take a moment to gush about college football.
Famously unpredictable, NCAA football is the most chaotic sports league you’ll ever watch. Every season brings Cinderella stories, field-storming, absurd comebacks, brilliance, bone-headed stupidity, heartbreak, and elation. The fans are passionate and loud. The players are raw and athletic. The unique blend of athleticism, skill, and occasional incompetence means that scarcely a week goes by without a novel absurdity on the field. Have you ever heard of the band on the field? The mustard bottle incident? The shoe throw? The quadruple doink? I assure you that these are not random word associations—these are all real things that have happened during college football games.
Allow me to display a few visual examples of the unpredictability of college football:
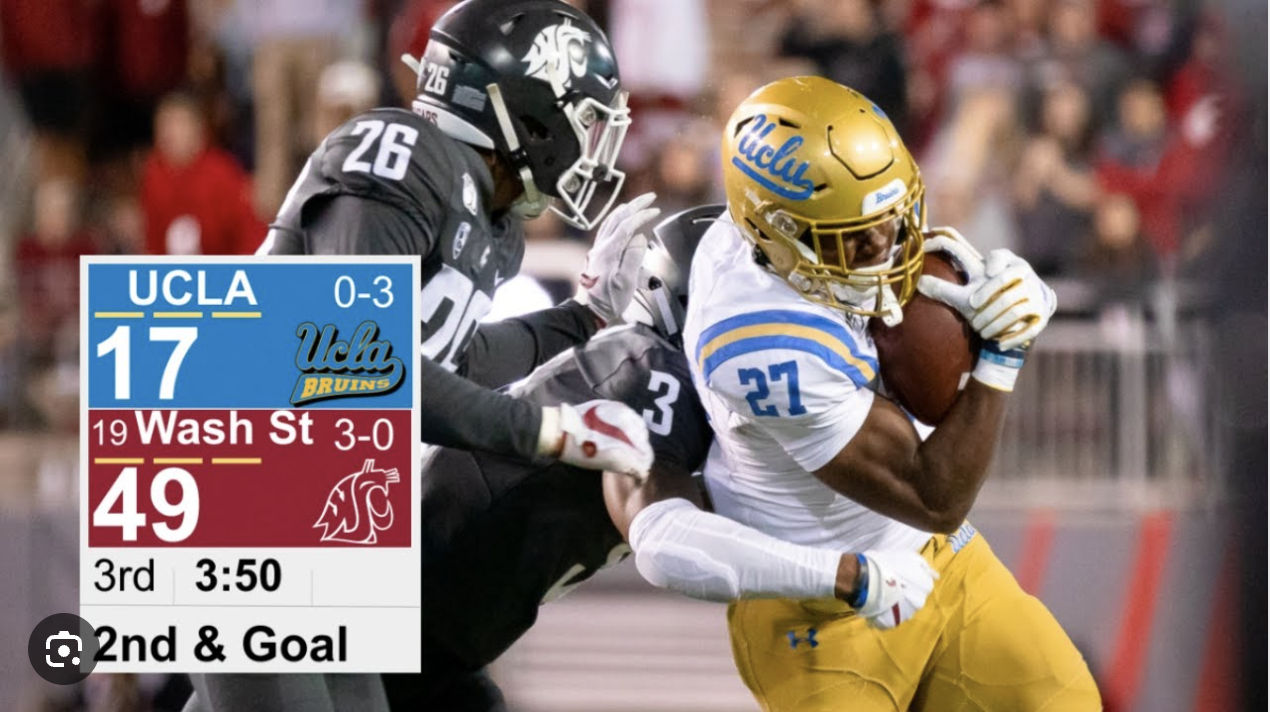
UCLA won this game.
Credit: PSC Highlights
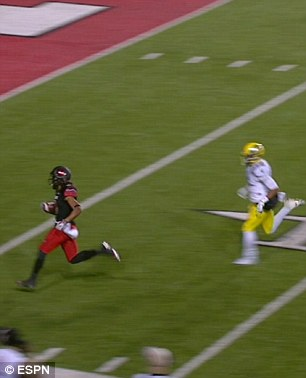
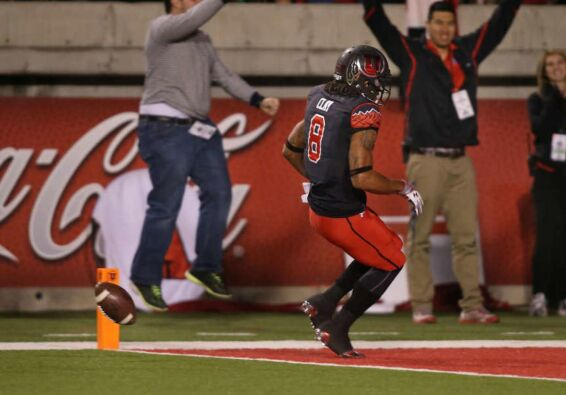
This play was a touchdown. But not for Utah.
Credit: ESPN
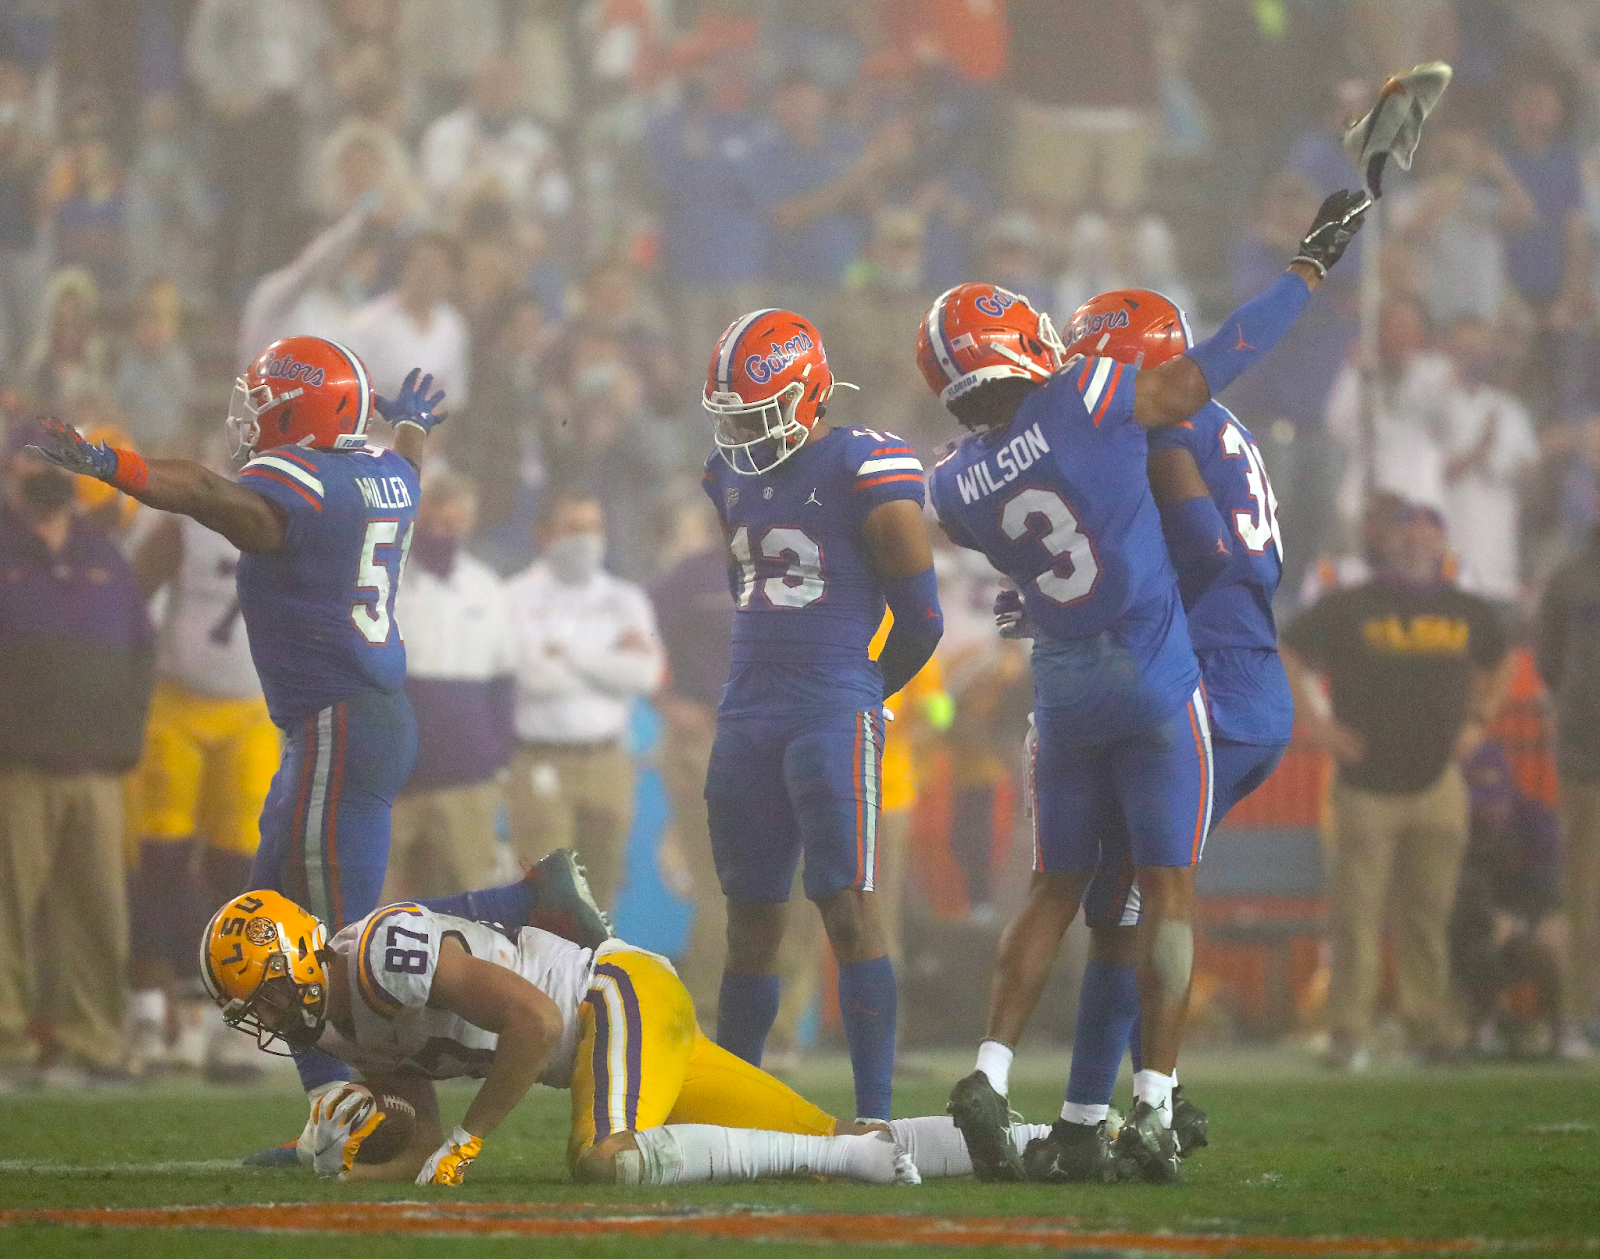
Florida lost this game… because #3 threw an LSU player’s shoe.
Credit: Brad McClenny/Gainesville Sun
All this chaos means that college football outcomes are notoriously difficult to predict. In 2022, the hosts of College Gameday—Desmond Howard, Rece Davis, Pat McAfee, Lee Corso, and Kirk Herbstreit, pictured below—correctly predicted game outcomes less than 64% of the time. The most successful analysts picked right about 70% of the time.
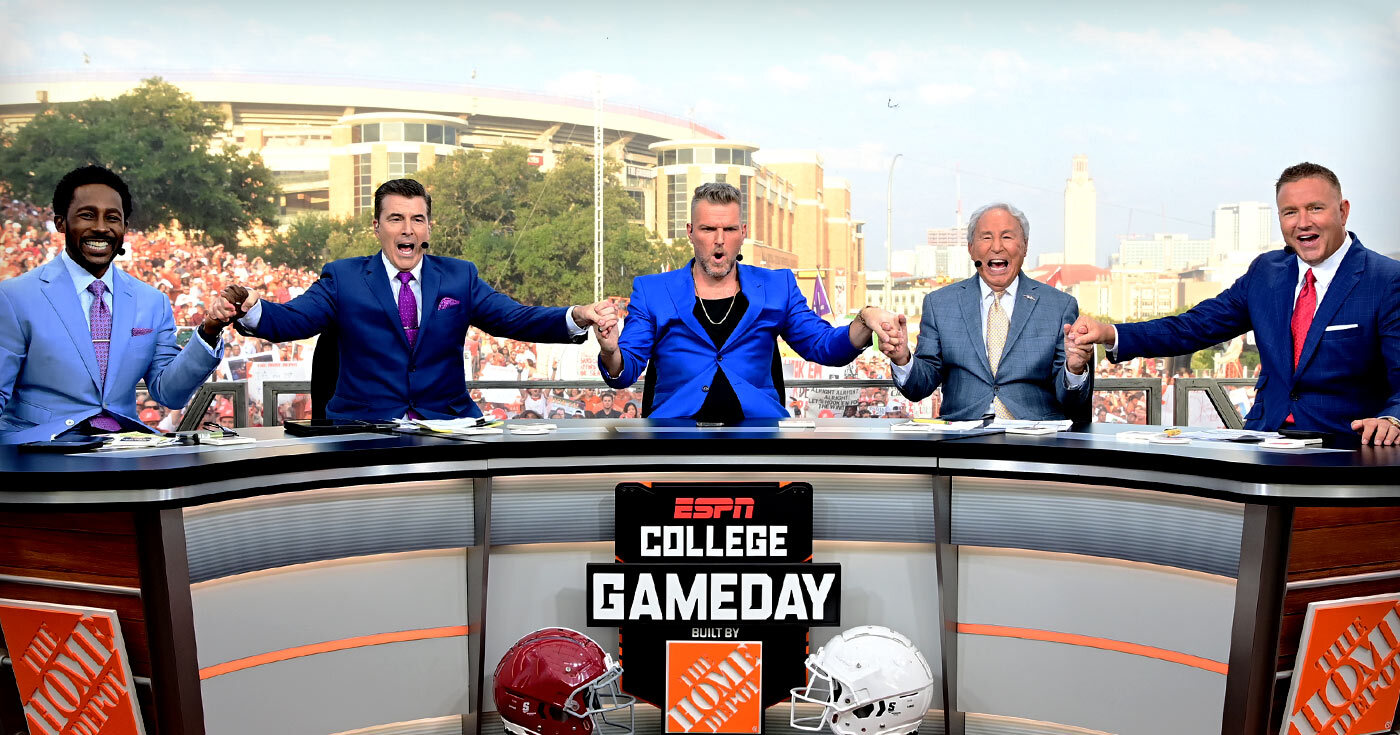
Credit: ESPN
In the face of such a difficult prediction problem, most normal people would choose not to bet their reputations on their ability to predict college football games. Statisticians, however, seem to be addicted to the impossibility. College football prediction models abound, but perhaps the most well-known model is ESPN’s Football Power Index (FPI).
FPI
The FPI prediction model is a simulation-based system of ranking college football teams. It uses team data on past game results, yards per play, turnovers, roster turnover, recruiting rankings, coaching tenure, home-field advantage, rest days, injuries, and travel distance, among other things. ESPN doesn’t disclose the specifics of the model, but they’ve shared enough to show that it’s quite complex.
So, with all this data and complexity, how well does FPI do?
The answer to that question depends on how you choose to evaluate model outcomes. If you judge FPI based on accuracy, then for the 2022 season, FPI picked the correct winner about 73.7% of the time. FPI’s correct pick percentage usually hovers around the 75% mark—a few percentage points above the best analysts but still low enough that many consider these results underwhelming.
However, evaluating FPI with accuracy creates a mismatch problem. The problem is that accuracy is a classification-based metric, whereas FPI is a probability-based model. That is, FPI doesn’t pick game winners; instead, it predicts each team’s probability of winning. This is known as probability prediction, and it is distinct from classification, where we make a binary guess of who will win.
The difference between prediction and classification is subtle but important. For example, when #9-ranked Clemson traveled to Durham to play an unranked Duke team in September, FPI projected that Clemson had an 87.5% probability of winning. This was FPI’s prediction. Based on the high probability in Clemson’s favor, many observers guessed that Clemson would win the game. Picking a winner in this way was a classification.
So, when Clemson turned over the ball three times and lost to Duke by a score of 28 to 7, anyone who made the classification that Clemson would win was unambiguously wrong. That isn’t hard to evaluate.
But what about FPI’s predicted 87.5% chance that Clemson would win? Was this wrong? Unfortunately, there’s no way to tell. Clemson and Duke would have to play repeated games before we could tell if that 87.5% probability is close to reality. Even then, prediction accuracy wouldn’t show whether the model’s predictions are correct overall. This is where model calibration shows its usefulness.
Calibrating FPI
Calibration measures the average probability prediction error for groups of observations. To calibrate the FPI model, we combine teams into bins based on their estimated win probability and then compare each bin’s actual win percentage to its average FPI-predicted win probability. This allows us to tell if a model’s probability predictions are generally close to reality. If FPI is well-calibrated, its predicted win percentages would be close to actual win percentages for each bin.
Below are the calibration results for FPI in 2022. For every game, I recorded FPI’s predicted win probability for each team and binned together teams with similar predicted win probabilities. I then compared each bin’s average predicted win probability with its actual win percentage. I show the bins for the 2022 college football season, along with each bin’s average FPI-estimated win probability and true win percentage.
| Bin | FPI Predicted Win Percentage | Actual Win Percentage | Error |
| Bin 1 | 2.98% | 3.91% | 0.93% |
| Bin 2 | 12.21% | 20.11% | 7.90% |
| Bin 3 | 23.83% | 26.40% | 2.58% |
| Bin 4 | 34.90% | 36.31% | 1.41% |
| Bin 5 | 44.44% | 44.69% | 0.25% |
| Bin 6 | 55.56% | 55.31% | -0.25% |
| Bin 7 | 65.01% | 63.64% | -1.37% |
| Bin 8 | 76.08% | 73.48% | -2.60% |
| Bin 9 | 87.79% | 79.89% | -7.90% |
| Bin 10 | 97.02% | 96.09% | -0.93% |
Below, I’ve plotted out the results for each bin. The dotted line represents a complete match between predicted and actual win proportions—a perfect prediction. As you can see, most of the bins are hugging that dotted line. Only two of the ten bins show a statistically significant difference between estimated and actual win percentages.
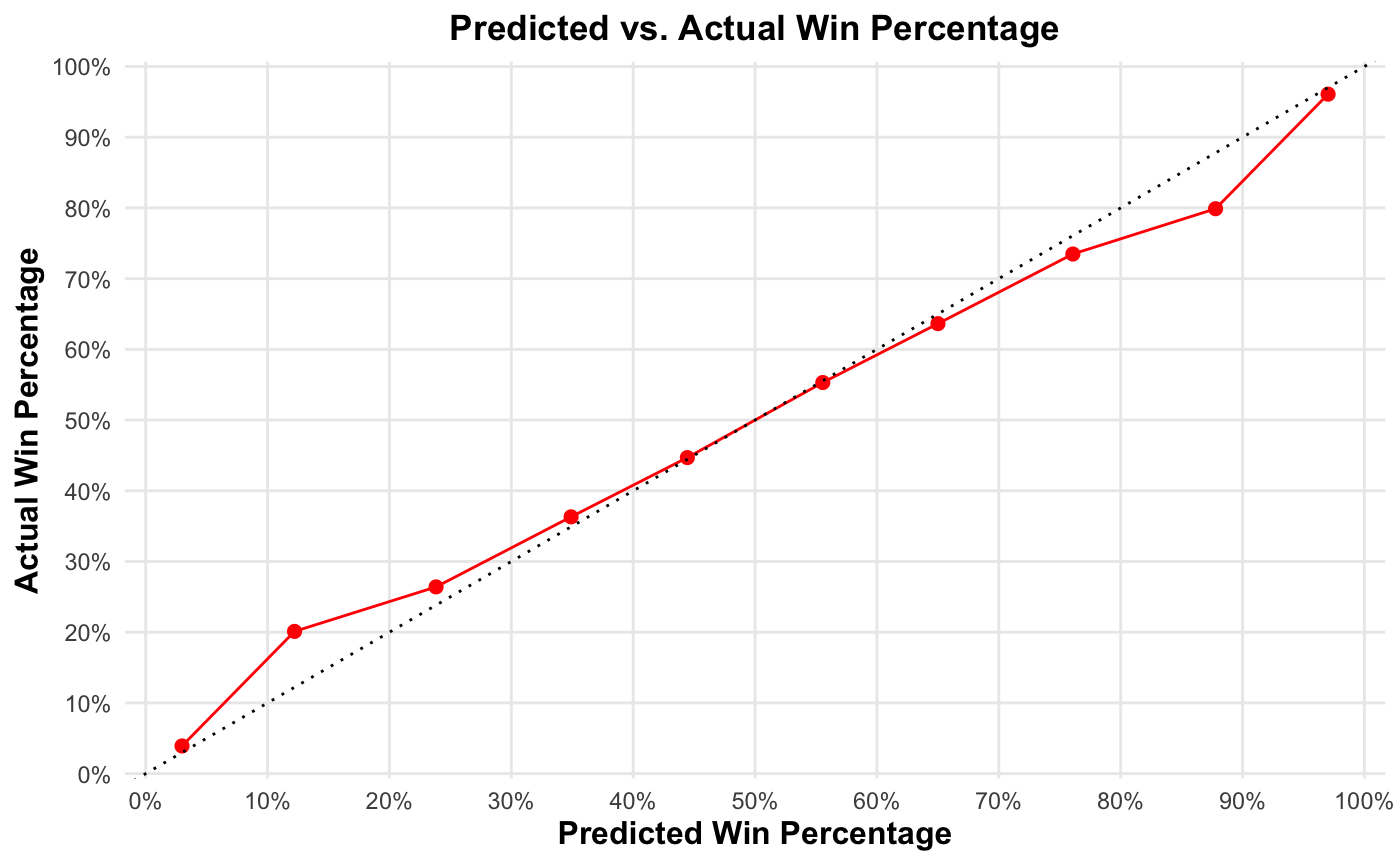
The upshot: Although FPI’s accuracy is only a few points above the best analysts, it predicts actual win probabilities remarkably well. When FPI predicts that a team has an x% chance of winning, that team can actually be expected to win x% of the time.
Conclusion
Accuracy is an important metric for evaluating predictive models, if only because it’s so easy to understand. However, as we’ve seen in the case of FPI, you can’t use accuracy to evaluate your model’s probability predictions. Statisticians can use calibration to compensate for some of accuracy’s weaknesses in evaluation. Where accuracy answers the question, “How often was the model right?” calibration answers the question, “Is the model right as often as I expect it to be?” Both questions are important.
All this is not to say that calibration and accuracy should always be your go-to evaluation metrics; there are many acceptable ways to evaluate predictive models. In addition to accuracy and calibration, well-established model evaluation metrics include the K-S statistic, concordance, discrimination slope, AUC, precision, recall, specificity, and F-score. A savvy statistician uses several of these metrics for evaluation. To assess model performance fairly, statisticians should avoid fixating on any one statistic and instead use a blend of metrics to pick the best model.
Columnist: Mike Kelly