
One of my favorite parts of attending the Institute for Advanced Analytics (IAA) is the conversations over morning coffee. A friend of mine gave me a coffee mug that has led to many compliments and more than a few questions.
When my friend gave me this mug, she inspired me to investigate the class of 24’s relationship with coffee. I conducted a survey of 40 students in the IAA, and I was surprised to learn that coffee may not be the key to the success of students at the IAA.
Coffee is the second most consumed beverage in the United States. The average American drinks 8.5 cups of coffee per week. The students surveyed in the class of 24’ consume 1.5 fewer cups of coffee per week than the average American. I created a visual plotting the number of cups of coffee students drink each week at the IAA.
I found this data very interesting. When I considered attending graduate school as an option after college, I spoke with many of my professors. Perhaps their war stories of coffee-fueled, all-night studying influenced me, and I came to North Carolina armed with coffee pods. I conducted this survey relatively far away from exams, and perhaps that played a role in the responses.
I consume coffee in a variety of different ways depending on my mood. After learning how much coffee students drink, I wanted to learn how students like to prepare their coffee. I discovered an almost 50-50 split between students drinking hot coffee and cold coffee.

Of the 40 students surveyed, 17 preferred hot coffee, and 16 preferred iced coffee. On the surface, this is an interesting statistic. Nearly three-fourths of Americans prefer their coffee hot. According to market research done by Mintel, considerably more Gen Z consumers ordered cold coffees than hot coffees in the first half of 2022. If the trend of Gen Z consumers’ preference for iced coffee continues, we may see the preference for iced coffee increase in the coming years for IAA students.
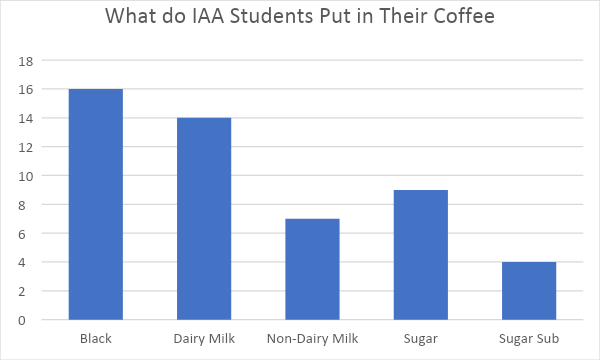
When talking with my classmates around the coffee machine during the early days of the MSA program, I was always surprised at the number of people who drank black coffee. I prefer to drink black coffee, but I have always been the odd person out among friends. Only 35% of Americans prefer their coffee black. In comparison, 50% of IAA coffee drinkers prefer to drink their coffee black. The other 50% of students add things to their coffee. I have charted the number of students who add different kinds of milk and sweeteners.
The results of my coffee exploration were very unexpected. Students at the IAA did not conform with the broad trends in the United States. As a biased enjoyer of black coffee, I will continue to bring up the average.
Sources
https://joesgaragecoffee.com/blog/coffee-drinking-statistics/
Columnist Jacob Ballington