
The use of analytics — using data and statistics to better understand something — is growing across most sports, especially ever since Michael Lewis released his book Moneyball, which illustrates the potential impact of analytics in sports.
Exploring new and evolving applications of analytics and data science is something that fascinates me. So, in my spare time, I decided to explore how analytics can be applied to one of my passions, football (or soccer for Americans). The field of football analytics, while still arguably at a nascent stage in its development, is advancing rapidly. I am engrossed by Expected Goals, Possession Value, and Pitch Control models, which use statistical concepts like Markov Chains and ML algorithms to model and quantify the value of events and performances of individuals and teams during a match.
The three different types of available football data are summary stats, event data, and tracking data.
Summary Stats
Summary stats refer to data regarding the number of passes and shots by players/teams or the distance covered during a match. There are a few dozen of these data points collected at the player and team level for every match, and they are easily accessible as they are available in the public domain free of cost. Finding summary stats can be as easy as opening your favorite football match tracking site/app or even simply googling the match. This data are useful as it can be used for understanding player/team performance at a high level at a quick glance.
Event Data
A level above summary stats, you have event data which refers to data regarding every ‘event’ during a match. An event is any action — like a tackle, dribble, pass, throw-in, etc. Event data consists of hundreds of data points per match, capturing which players were involved in the action, location on the pitch, time of action, etc. It is collected by companies like Opta or Statsbomb and has limited availability in the public domain as they release only small portions of their datasets to the public.
These data are quite valuable in terms of the visualizations, analysis, and insights they can generate. The majority of the recent and ongoing developments in the field of football analytics primarily revolve around the use of event data. Expected Goals (xG) and Expected Assists (xA) are the most famous examples of the application of analytics on event data. Event data are also what I decided to focus on when exploring the field of analytics.
Thanks to the visualization course that was part of the program here at the Institute for Advanced Analytics, I was equipped with the skills needed to build my own football analytics dashboard.
Tracking Data
Tracking data is the most granular level of data collection in football. It continuously tracks the position of all 22 players, plus the ball, at intervals of fractions of a second throughout the match. The tracking data consists of hundreds of thousands of data points per match. The data are collected by companies like Metrica and Skillcorner, to name a few. Currently, its availability in the public domain is extremely limited as only anonymized data for a handful of matches have been released to the public. Tracking data combined with event data can be used to generate even more powerful insights into defensive and offensive player positioning.
Dashboard
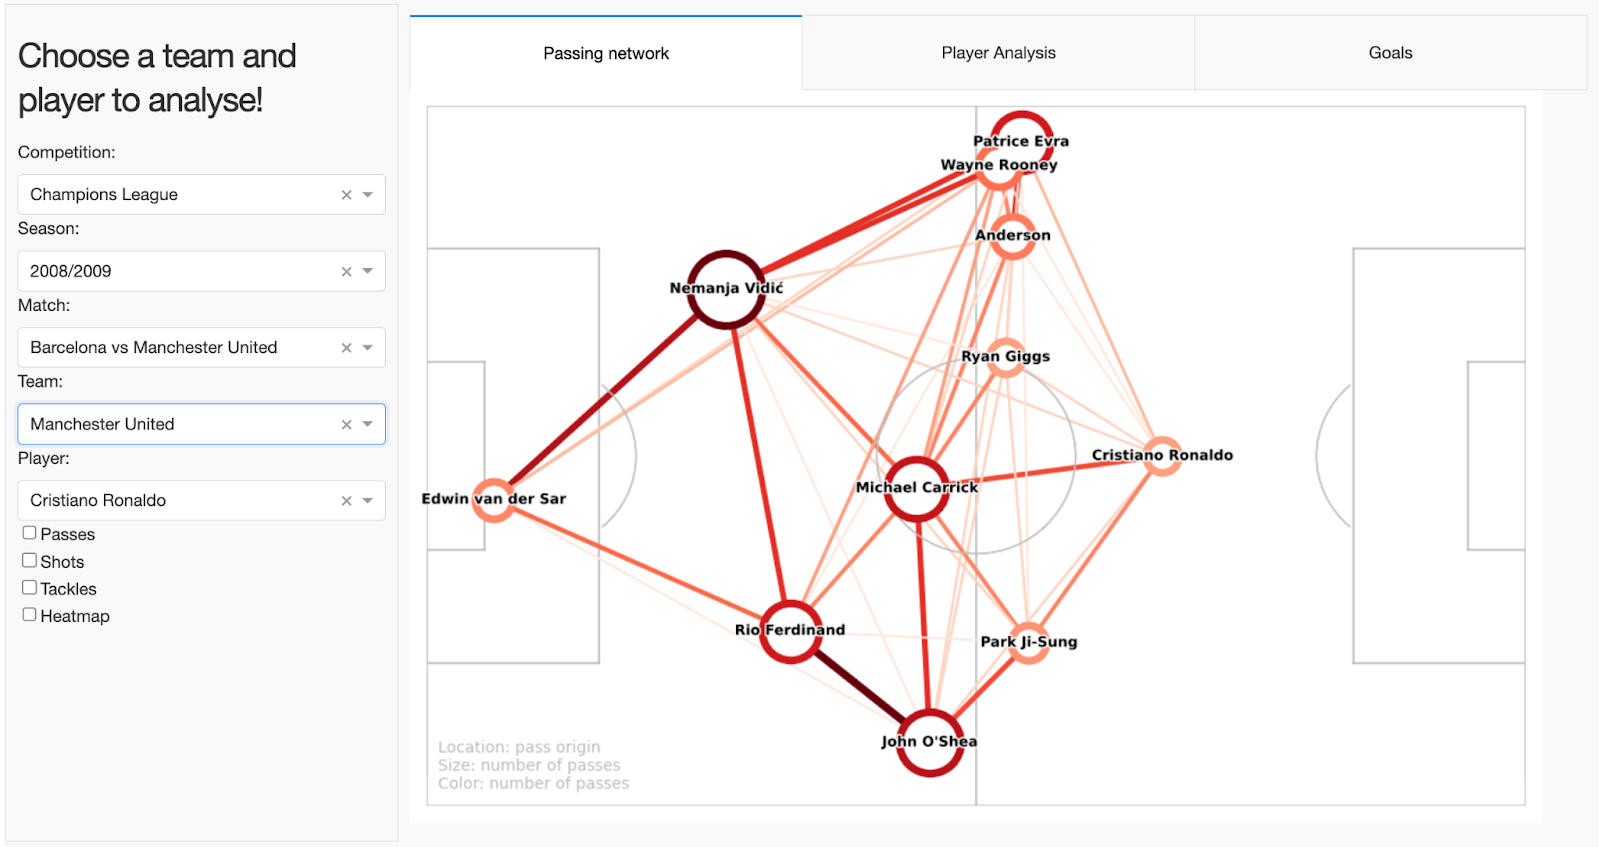
Check out the dashboard I created using Plotly Dash to visualize passing networks, goals, and player contributions.
Columnist: Hardy Agarwal