
Inflation, Inflation, Inflation!
With inflation soaring lately, it is hard not to ponder how to stay ahead of it and how to financially secure your future. As students embark on their analytics journey at the Institute for Advanced Analytics, a basic understanding of financial investing may help with investment goals once the paychecks start to appear. Along with potential loan repayments, a portion of your salary may be invested to capture market returns and offset inflation.
The goal of this article is two-fold
- understand and visualize a popular investment product, namely the Standard and Poor 500 Index (S&P 500)
- understand how your S&P 500 index fund investment can be tweaked to improve market risk diversification and enhance returns (“The Tweak”).
The motivation for this article is drawn from my personal journey and my experiences with personal finances, specifically investments.
After completing my undergraduate studies in Engineering and then obtaining an MBA-Finance several years later, I realized the true potential of compounding returns by starting investing early – something I did not fully participate in after my undergraduate degree. The coursework in MBA helped me realize the exponential power of compounding returns, the time value of money, and the presence of different investment vehicles in the market to help you achieve your investment objectives.
To illustrate further, using an average market return of 7%, a $100 investment today will produce $197 in 10 years, a 97% return. Delaying investing that $100 by just one year will reduce the total return to 84% – a reduction of 13%. The power of making money work for you through compounding returns is paramount to an investor’s journey.
An important disclaimer: this article is for INFORMATIONAL PURPOSES ONLY. It is always prudent to consult with a professional prior to embarking on any investment strategy.
S&P 500 Index Overview
S&P 500 is a stock market index that tracks the performance of 500 large companies listed on stock exchanges in the United States. S&P 500 index fund investment is attractive because it is low cost (annual fees), passive (minimal effort), and provides selective market risk diversification.
- Index fund investing is advisable because it provides a low-cost alternative to investing with a portfolio manager or mutual funds.
- A passive minimal efforts investment is attractive because students will be busy in their new careers post-graduation.
- The index fund also provides exposure to 500 large companies, which improves investment risk-to-reward ratio and enhances returns.
This is in contrast to investing in just one or two companies, which significantly increases a portfolio’s risk. Since a lot of portfolios compare their performance to the benchmark S&P 500 index (to see if they “beat the market”), investing directly in the S&P 500 index fund is a solid investment strategy to capture optimal returns from capital markets.
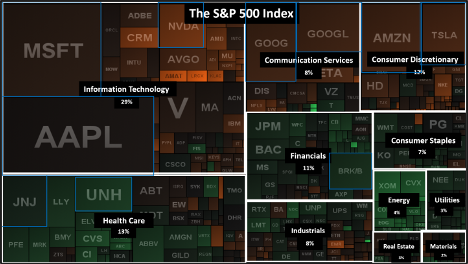
To avoid the perils of blindly investing in an investment product, it would be helpful to first understand the composition and weightage of the S&P 500. The composition heat map in Figure 1 helps visualize that there are 11 sectors in the S&P 500 index fund (Information Technology, Health Care, Financials etc.). Each of these sectors are labeled in the black boxes, and their respective percent weightings in the index are shown underneath it. Companies that comprise a given sector can be seen visually on the heat map and are denoted by their stock ticker symbol (for example, Apple is ‘AAPL’, Microsoft is ‘MSFT’ etc.). The size of the box around a company’s stock ticker symbol represents the weightage of that company in the index fund. For example, Apple and Microsoft have a high market capitalization, so they are represented by larger boxes in the heat map (higher weightage in the index). This is in contrast to Nvidia (ticker ‘NVDA’) and Visa (ticker ‘V’), which have a smaller market capitalization and are represented by smaller boxes.
To illustrate further, a $100 investment in the S&P 500 index fund results in distribution of that investment based on the size of boxes of companies shown (i.e., their weightage in the index fund). Out of the $100 invested, $29 will be invested in the Information Technology sector, $13 invested in the Health Care, $12 invested in Consumer Discretionary etc. (as per the sector percent weightage shown).
The visualization in Figure 1 helps to quickly understand:
- The composition of the S&P 500 index fund, its sectors and the comprising companies.
- The Information Technology sector dominates the index fund by weightage.
- A majority of the index is dominated by a handful of companies.
The Tweak
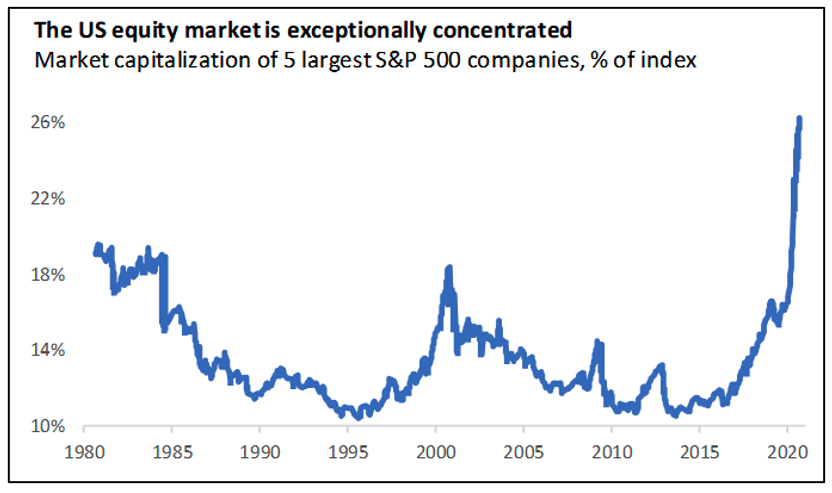
The S&P 500 index is now approaching a record concentration of just a few companies, as seen in Figure 1 and also in Figure 2 below. This represents an investment idiosyncratic risk, which is concentration of dollars in a few companies resulting in over-exposure to company specific risks (as opposed to overall market risks). Top ten companies in the S&P 500 now make up 28% of the index fund, six of which are in the technology sector.
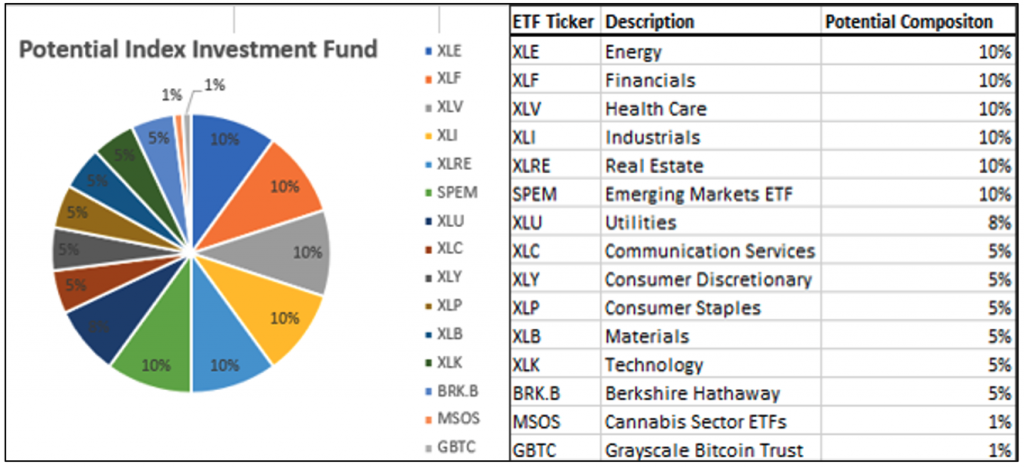
The goal of any portfolio investment should be to produce the best risk-to-reward ratio and to ensure portfolio sustainability. A better approach would be to explore pure-play sector exchange-traded funds (ETFs), assign weightage to these ETFs in your portfolio, and then optimize the weightage based on macroeconomic factors such as inflation and interest rates. This small tweak to the index fund investing approach will provide a higher market diversification, reduce sector idiosyncratic risk, and provide flexibility to react in evolving macroeconomic conditions.
The pie chart in Figure 3 shows an example of portfolio construction with pure-play ETFs for each of the sectors in the S&P 500, along with exposure to cryptocurrencies and emerging markets. The weightage for each of the ETFs in the pie chart can be tweaked based on an individual’s preference and in light of macroeconomic factors such as inflation and interest rates.
To summarize, passive index fund investing is a great strategy for a busy professional to capture optimal market returns and to help offset inflation.
Prior to investing, it is prudent to thoroughly understand the investment product.
A compositional heat map visualization of the S&P 500 index fund helps to understand its components and formulate associated investment risks. Due to overconcentration of certain sectors in the S&P 500 index and the index not offering exposure to emerging markets or cryptocurrencies, it is worth exploring “The Tweak.” This new approach sets out to build your own index by finding pure-play ETFs in all the sectors of interest and then assigning weightage according to your investment preference and market conditions.
Columnist: Nish Torane