When people think of “cycling,” something like the Tour de France might come to mind. However, cyclists can be mountain bikers, commuters, or anyone on any kind of bike. If you ride regularly for utility, training, or enjoyment you may be curious about your rides:
- How fast can I ride to work?
- How many hours did I train this month?
- How many miles can I explore?
Curiosity about these things requires data, which can inform your commute and fitness goals or expand your opportunities to explore further by bike.
Super-Personalized Data Collection
Give yourself credit for the work you’ve done!
Luckily, this information is very easily accessible and can be tracked through your smartphone or other devices (such as running watches) that can record speed, distance, time, and sometimes heart rate. From this, metrics like average speed, average heart rate, and other data points can be calculated. Some apps (like Strava) even track and compile all of this for you, and geographical tracking data adds another dimension: visualizing your route!
Strava also functions as a social platform allowing you to view the routes others chose to take, city heatmaps for roads, and areas frequently used by cyclists. In addition, it allows you to build more adventurous routes of certain distance or elevation.
Using Your Data
Get smarter, faster, or find more enjoyment!
Here is a geographical map of an activity of mine on Strava. It was a 100-mile ride in the Blue Ridge Mountains. Also included is an elevation chart that lays out terrain features over the course.

Being able to evaluate a ride file allows you to find the best in your cycling:
- A route through the city (geographical tracing map) means your commute gets faster (or maybe you take a prettier greenway next time on the way home!).
- How your body handled the workout intervals (heart rate graph and calories burned) shows what your body is capable of and whether you’re getting stronger! (All without hiring a coach).
- Knowing the time and amount of uphill elevation it took for you to reach that destination or great vista (when touring or adventuring) means you can choose a different type of route for a similar reward next time.
Quantifiable Performance for Everyone
Easy, accessible, and fun!
Every ride or workout gives you new, personal data to learn more about yourself and your environment. With the ease of access to record ride data and briefly self-evaluate, many engineers, data scientists, or other analytically-minded people can enjoy this personalized library of files.
My Own Applications
Time series analysis & data wrangling
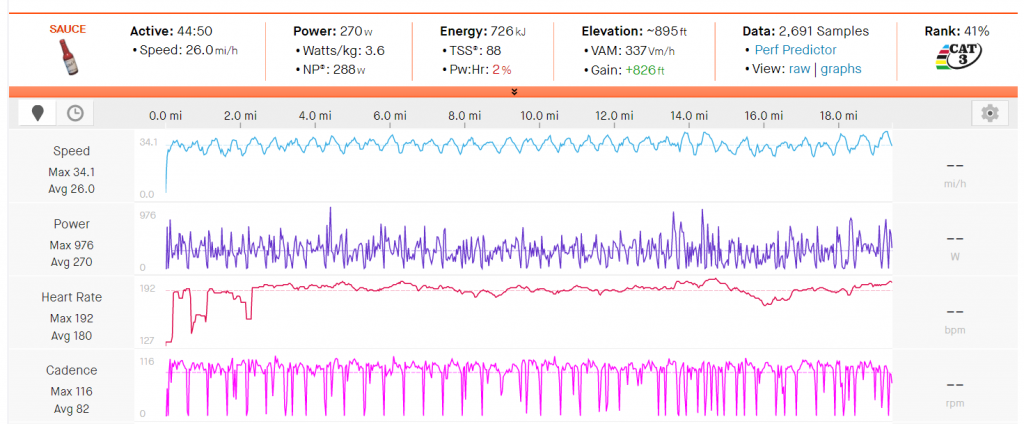
This is how data is displayed in the ‘analysis’ tab on Strava. It includes Speed, Power, Heart Rate, and Cadence metrics for the duration of a 45-minute race. In this race, I rode a steady breakaway in the middle section to lap the field which is shown in the heart rate smoothness.

If you’re like me and want much more than the simple dashboard on a free app (..and happen to have a data analyst skillset..) you can export your ride file data as ‘.fit’ files and do some post-race analysis or assess how well you hit your numbers in training. However, the files include more metadata than I could care about for every single second of an hours-long race. This means I dropped half the columns, rolled it up to minutes, and made it a time-series object to model properly.

In our coursework at the Institute for Advanced Analytics, we’ve been manipulating different data types using R and conducting thorough time-series analyses in homework projects. All of this has been directly useful in my own work to construct detailed race-report analyses that put together both the numbers required to keep up and a look at the tactics needed to get a result (sometimes I get on the podium). Evaluating what I can do physically and strategically to win races informs my training and practicing detailed self-assessment is what we should do in all areas of performance.
While you can ‘nerd-out’ on metrics like power curves, power-to-weight ratios, and other efficiency-maximizing gains in the world of endurance sports, if you’re a self-realized ‘data nerd’ like me then cycling satisfies all the data wants. Maybe I’d be faster if I spent more time training than looking at my numbers, not sure if that factors into my analyses…
Finally, Just Go ‘Play Bikes!’
The more rides to the office, fun cruises, or workouts you complete, the more you get to look at. This can be satisfying to rack up yearly totals (miles, hours) or keep track of all your great adventures! Go for a ride soon, and you don’t have to track it, but it’s super easy to do so even just for your personal enjoyment (‘wink-wink,’ ‘nudge-nudge’).
Columnist: Alec Perrin
