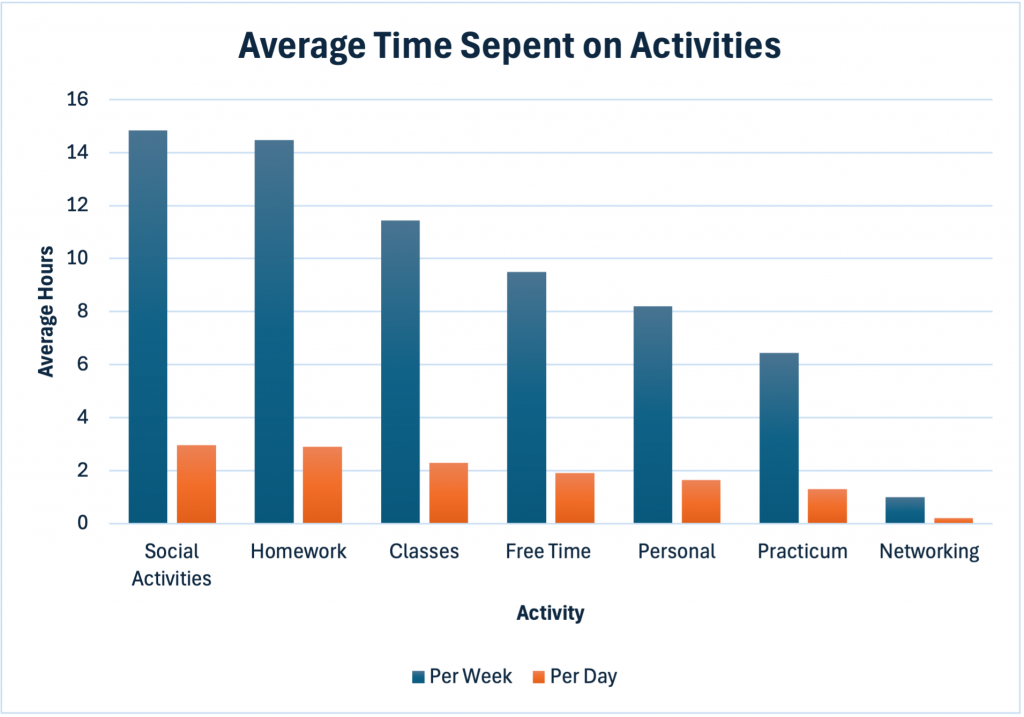
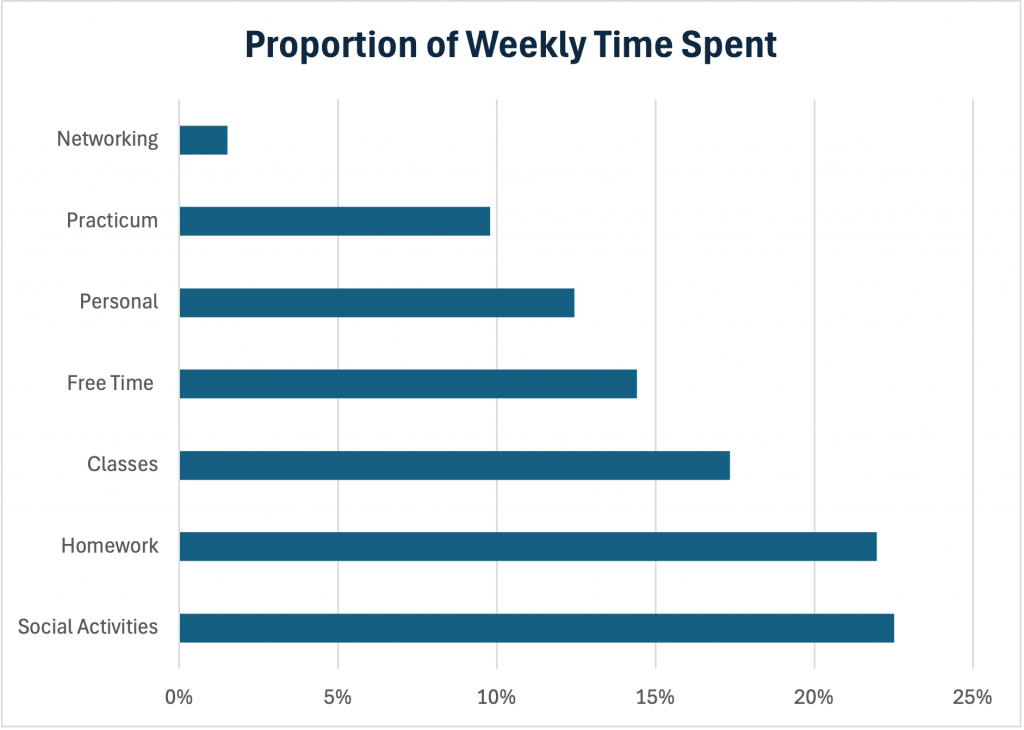
I tracked my activities during weekdays for three weeks at the start of Fall 1 (August 19th–September 6th) to get a sense of how my time was spent and categorized it into seven key areas. Here are the results:
1. Social Activities
Percent of Time per Day: 23%
Average Hours per Week: 14 hrs and 50 mins
Average Hours per Day: 2 hrs and 58 mins
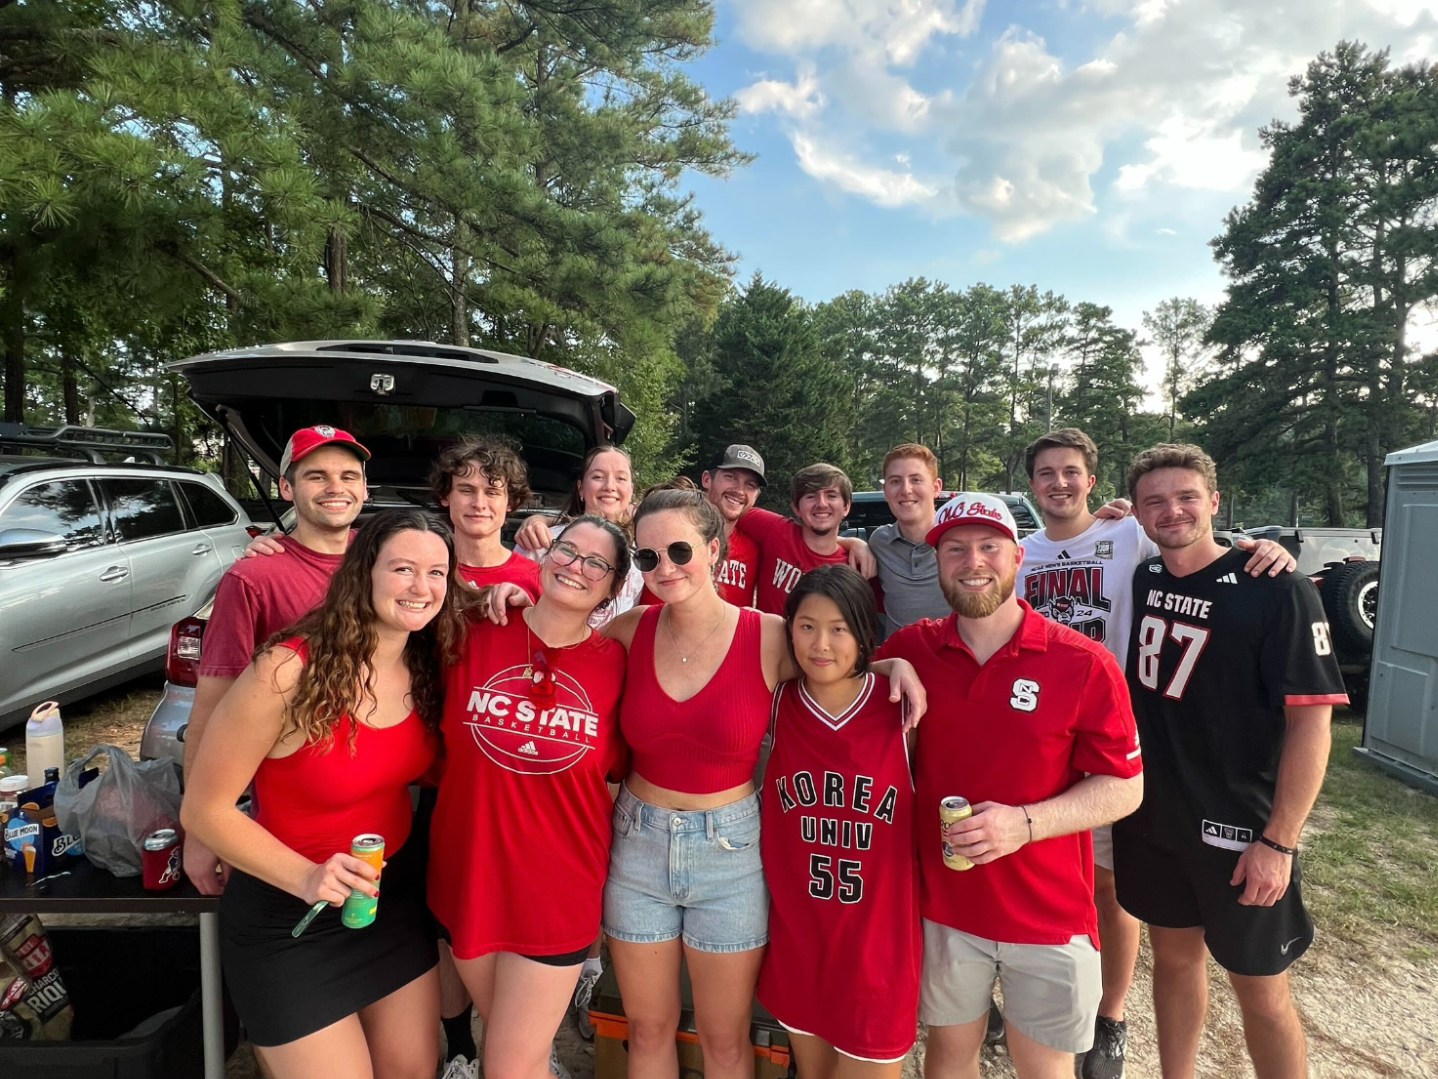
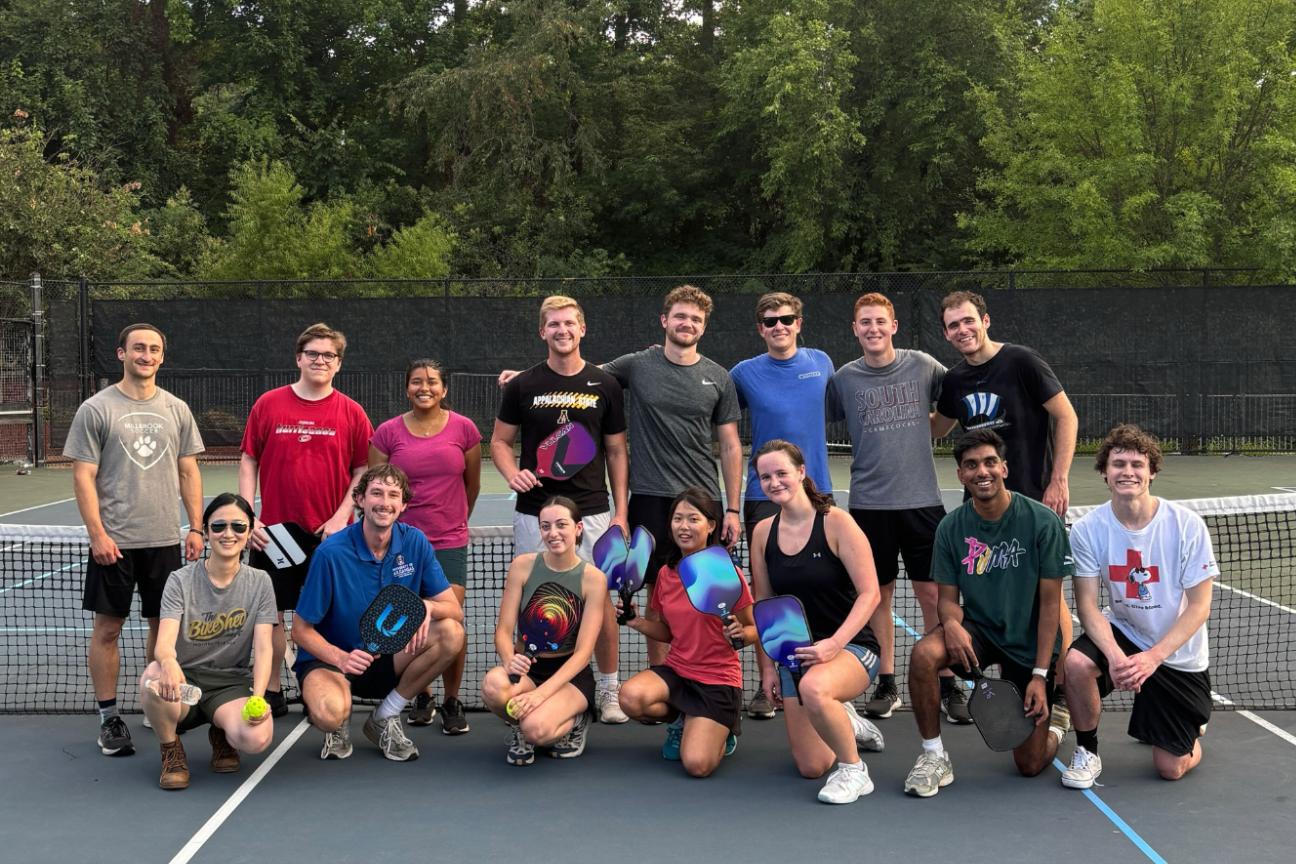
Social activities, which were vital for recharging my energy and motivation, occupied the majority of my time. Social activities are the main way I connect with my friends and maintain my sanity, so I devote a lot of time to them at the cost of having less “free time” (which I prefer). Over this period, social activities included: pickleball, nightlife, “The Bachelor” watch parties, football games, game nights, trivia, etc. I recommend utilizing Slack to connect with classmates with similar interests and using it as a catalyst for organizing social activities. Most students are eager to make friends early in the program; take advantage of this opportunity.

2. Homework
Percent of Time per Day: 22%
Average Hours per Week: 14 hrs and 28 mins
Average Hours per Day: 2 hrs and 54 mins
During this period, I spent more time doing homework than attending classes. It’s worth noting that my calculation of homework includes homework team meetings and faculty meetings for discussing questions, which adds to the total. It’s interesting to reflect on this because later, I found myself with more independent homework and fewer homework meetings. Early on, my homework team spent significant time together as we established our workflow. In Fall 2, I had more meetings, but they were shorter and more efficient. Time spent on homework varies from team to team and how much the team likes to work on things together.
3. Classes
Percent of Time per Day: 17%
Average Hours per Week: 11 hrs and 26 mins
Average Hours per Day: 2 hrs and 17 mins
Class time strictly refers to scheduled calendar hours. During these weeks, the class schedule was lighter due to practicum reveals, which created half-day schedules, and the Labor Day holiday. Typically, a lighter class schedule comes with an expectation of doing something else, like spending time working on practicum or homework assignments. Nevertheless, having less class time certainly made it easier to dedicate more time to social activities.
4. Free time
Percent of Time per Day: 14%
Average Hours per Week: 9 hrs and 30 mins
Average Hours per Day: 1 hr and 54 mins
Free time refers to relaxing which includes time spent lounging, watching TV, phone use, or hanging out with my roommate that was not a planned social activity.
5. Personal
Percent of Time per Day: 12%
Average Hours per Week: 8 hrs and 12 mins
Average Hours per Day: 1 hr and 38 mins
Personal time included “housekeeping” items/personal tasks that took up time in my day, which typically included time spent cooking, cleaning, errands, etc. but also included extraneous things like naps or decorating. This did not include time spent getting ready in the morning or preparing for bed in the evening.
6. Practicum
Percent of Time per Day: 10%
Average Hours per Week: 6 hrs and 27 mins
Average Hours per Day: 1 hrs and 17 mins
Time dedicated to my practicum project included the time spent working on it independently and the meetings dedicated toward it. Practicum teams were revealed at the start of Fall 1. While we had not yet received our data or delved deeply into the project, we had background research assignments, ethics assignments, and NDA/security items to complete. Additionally, as a team lead, I often had to take care of administrative tasks such as emailing, planning meetings, talking to faculty, etc., which added up.

7. Networking
Percent of Time per Day: 2%
Average Hours per Week: 1 hr
Average Hours per Day: 12 mins
Networking consisted of coffee chats and activities focused on speaking with alumni to learn more about their work. It likely ranked last for me because I had only just started. However, it picked up more in the following weeks. I recommend taking advantage of your free time early on to network while your schedule is more flexible. You don’t have to wait for Career Services to tell you to start!
Conclusion
The data reinforces the idea that balancing academics with personal and social activities is both achievable and essential. It’s possible to have a life outside of school! Summer 2 and Fall 1 are easing you into the program, so take advantage of it!! Get to know your classmates and faculty members. Do activities with your practicum team. Leverage the fact that NC State undergraduate students haven’t started yet, meaning the courts, gym, and other amenities are empty. Your peers will be part of your network and be a resource for school so take the time to have fun and remind yourself it’s okay to be social.
Fall 2 picks up fast, you’ll have more classes and homework. Fall 3 has fewer classes but is very practicum-heavy. The amount of time spent on practicum work varies depending on your consistency and the specific project. My time breakdown looked very different in Fall 2 and 3. Practicum work took up most of my time, followed by homework, while free time dropped noticeably. I had much less time to socialize, so I’m glad I prioritized social activities in Summer 2 and Fall 1, building relationships I could rely on later. I recommend future students do the same.
Columnist: Louisa Swintosky
