
 Like everything else in 2020, this Halloween will be different from any other year. That doesn’t have to be a negative thing, though. Fewer trick-or-treaters means you get to keep more of the candy bowl to yourself. I am celebrating early this year with an analysis of FiveThirtyEight’s Ultimate Halloween Candy Power Ranking dataset, showing the results of an online voting challenge for 85 different candies commonly handed out to trick-or-treaters on Halloween. More than 8,000 people were shown 2 pictures (e.g., a Snickers bar and a Butterfinger) and asked to choose which one they prefer. I then analyzed the results to help you make the best candy purchasing decisions for your budget. (#SweetTooth)
I used hypothesis testing to see if popular candy is more expensive or sugary than less popular candy. I also used principal components analysis (PCA) and clustering to identify three major candy groups that appeared in the dataset. My biggest takeaway is this: if you want to make everyone happy, chocolate and peanut butter are the undisputed winning combination. All Reese’s products were winners. If you’re feeling budget-conscious but still want to hand out winners to trick-or-treaters, then go for Almond Joy, Sour Haribo Gummy Bears, and AirHeads.
I should also point out that winning candies are more than 50% more expensive than loser candies on average, so you might be tempted to go cheap. However, if it means the difference between pacifying the juvenile zombie hordes or waking up to a 24-pack of TP strewn in your trees, then it might just be worth the splurge.
Methodology & Analysis
FiveThirtyEight’s final Power Ranking dataset is composed of 85 fun-sized candies and 12 descriptive variables. There are nine descriptive binary variables, including chocolate, fruity, and pluribus (multiple candies in a pack, like Skittles or M&Ms); two continuous percentile variables ranking candies by sugar content and price; and a continuous variable tracking the overall win percentage for each candy from the 269,000 match-ups.
To better understand the preferences of mask-clad tricksters that may come knocking at my door, I performed a cluster analysis on the rankings and did some hypothesis testing to determine whether candies with certain characteristics were more likely to be in the “Winners” or the “Losers” category.
Clustering Common Candy Groups
Clustering can be a great way to take a group of items (e.g., different kinds of candy) and divide them into logical groupings based on similarities and differences. I used a technique called k-Means clustering to create the clusters for this analysis. I also used principal components analysis to reduce noise in the original dataset and make it possible to plot the clusters in two dimensions. The two principal components I used captured 56.7% of the dataset variance, so I was confident I would identify some useful clusters.
Clustering is not an exact science. There is a bit of art to looking at each cluster’s composition and piecing together its different characteristics to discover its identity. As an example, you might look at a cluster of candies and see that it has high levels of “Chocolate” and “Peanut Butter” but very little “Fruity” relative to the overall group of candies. That gives you a clue that you are probably going to find Reese’s and Butterfingers in the cluster and not Skittles or Starbursts.
After settling on using three clusters to group the different kinds of candy, I looked at each cluster individually to see what combinations of characteristics were unique to each of them.
I used Dr. Race’s ClusterProfile function in R (Thanks, Dr. Race!) to plot histograms of each cluster’s variable composition compared to the overall dataset composition histograms. In the plots below, a row of plots corresponds to a candy characteristic, like “Chocolate.” Each column of plots corresponds to one of the three clusters. In each histogram, the salmon-colored bars represent the cluster’s variable composition, and the purple bars represent the variable composition of the overall dataset.
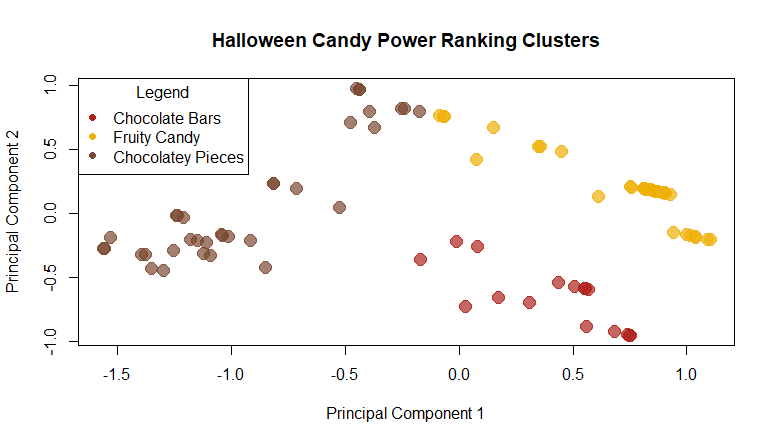
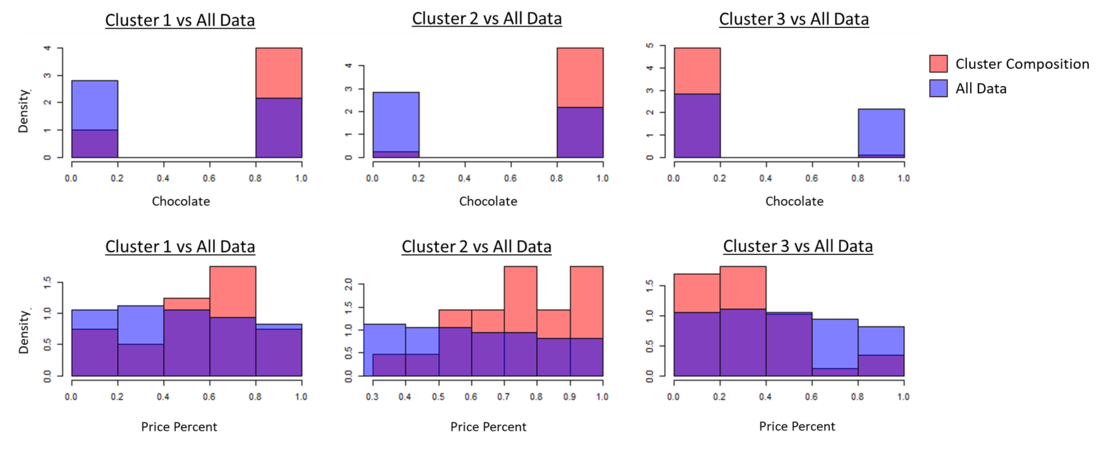 After reviewing the histograms for each cluster and characteristic, three major clusters emerged: Chocolate Bars, Fruity Candy, and a type of candy I called “chocolatey pieces,” which would include candies like M&Ms. I labeled each candy with their newly assigned cluster type and plotted them in a principal component plot. The clusters are clearly grouped, which suggests these are logical clusters.
 To continue investigating, I subdivided the full dataset into “Winners” and “Losers” datasets based on whether the candies’ win percentages were above or below 50%. I repeated the PCA and cluster analysis separately for both the winners and the losers with the following results.
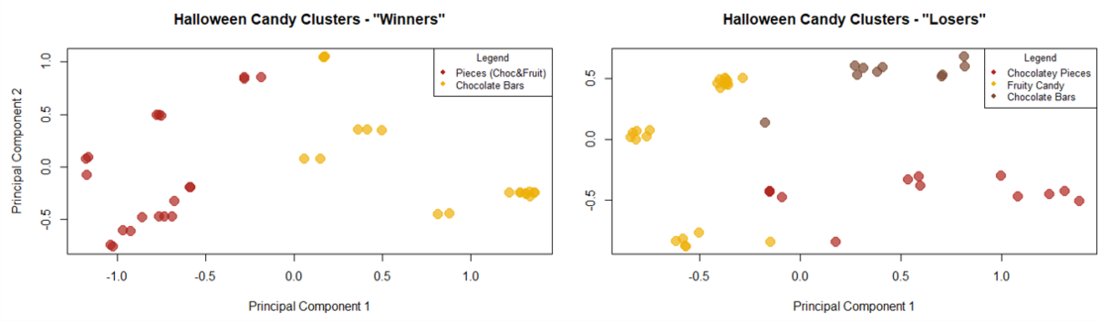 As you can see in the Losers plot (above right), the Losers group’s cluster characteristics are similar to those of the overall dataset. There were very few fruity candies in the Winners group (left above), so there were only two major clusters: chocolate bars and pieces (both chocolate and fruit).
Comparing Winners & Losers
To complement the cluster analysis, I also conducted several hypothesis tests (alpha=.05) to compare Winners and Losers. Here are some of the most interesting results:
- Winners are more expensive than Losers (p=.0006), weighing in at $.58/unit vs. only $.37/unit for Losers.
- Chocolate is more common among the Winners (p=<.0001), with 75% of chocolate products ranking as Winners.
- Peanut butter/almonds are more common among the Winners (p=.002).
- Fruity candies are more common in the Losers group (p=.004), accounting for 58% of Losers and only 28% of Winners.
- There is no significant difference in sugar content between Winners and Losers (p=.09).
Recommendations
From the cluster analysis, it’s clear that if you want to make everyone happy, you should stick with chocolate bars, especially anything with peanut butter. The most popular sweets overall were Reese’s Peanut Butter Cups, Reese’s Miniatures, and Twix. Almond Joy and AirHeads are cheaper Winner options. On the other end of the spectrum, the most expensive losers, which should be avoided if at all possible, were Smarties, Ring Pops, and Nik-L-Nip (I had to google that one).
If you’d like to review/fork the code for this project, it is available in this GitHub repo.
Columnist: Eric Sims