For many of us, our knowledge of how a proposed bill becomes a law begins and ends somewhere around Schoolhouse Rock’s “I’m Just a Bill.” What you probably don’t know is that federal law mandates that every member of the public (that’s you and me!) must have an opportunity to submit comments on any proposed federal legislation before it can become a law. Each year the U.S. passes 8,000 new federal laws, generating more than 1,000,000 public comments that must be read and cataloged. We can feel our fellow data geeks perking up at this thought—all that text being human read? Can’t we use text analytics for that? Turns out, we can, and with impressive efficacy.
The Data
For the sake of this project, we decided to analyze the comments of a rule proposed by the Grain Inspection Packers and Stockyard Administration (GIPSA) from 2008, the Title XI of the Food, Conservation, and Energy Act of 2008: Conduct in Violation of the Act regarding meat packing and poultry farming. We chose this rule because Viola had some previous familiarity with the rule, its implications, and some of the people who support it from her time over at RAFI-USA.
All of the comments for every proposed law are housed at regulations.gov. Rather than individually download each comment, we wrote a script on Python in order to automatically webscrape the comments and store them in an Excel file. We were able to access the comment files using the website’s API. However, the website was not prepared to have the number of files accessed as quickly as we were accessing them and was taken down for repairs mid project (yep- we broke it!). After the website was put back up, we were able to download 462 of the 33,129 comments on this rule. These 462 represent the sample of the online comments that we used for our analysis.

Clustering
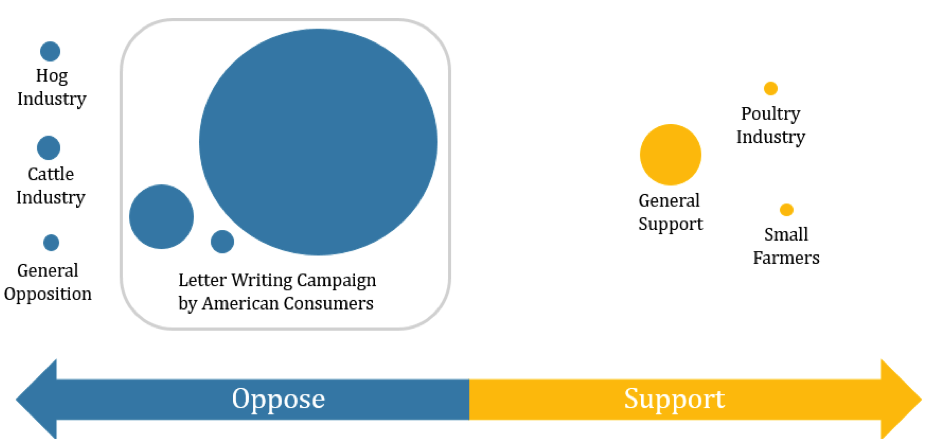
Using SAS Enterprise Miner’s clustering function, we analyzed our sample of comments to group together similar comments. This broke our sample into 9 clusters. The largest cluster identified a letter writing campaign– a large group of people turning in the same form letter with their signature attached. This ultimately led to approximately 50% of the comments being identified as letter writing campaigns, allowing us to read only a few of the comments in order to determine whether the comments opposed or supported the law.
Figure 1 summarizes the clusters we identified. Bubble size correlates to the size of the cluster, and placement on the line and color of the circle indicate whether the comments in that cluster are in support or opposition of the rule.

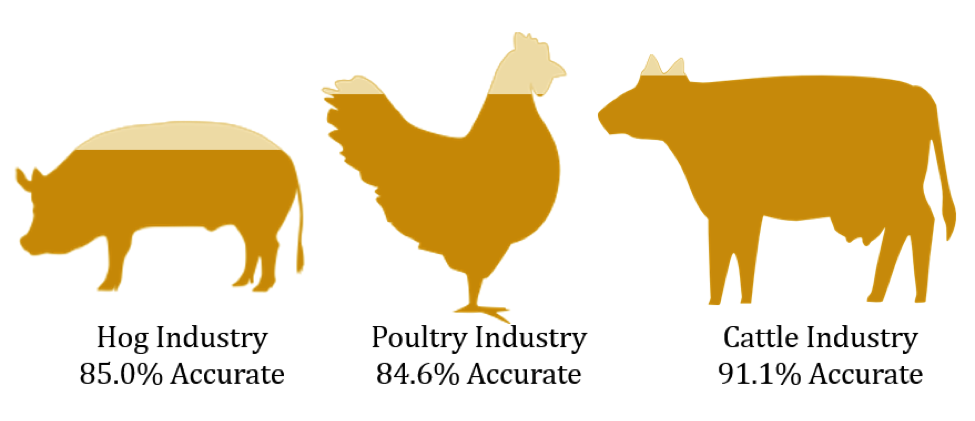
For the remaining clusters, we were able to correctly predict a commenter’s industry sector with an 85-90% accuracy rate. The hog, poultry, and cattle industry were the three main sectors that have a stake in this proposed rule. The hog and cattle industries generally opposed the rule; whereas, the poultry industry generally supported it. After determining the general sentiment of the clusters of comments, we decided to analyze sentiment on a comment level.

The second bit of key information we wanted to extract from each comment is whether the commenter supports or opposes the law. This is a perfect application of something called sentiment analysis, which allows us to predict the writer’s attitude toward a topic based on the words used to discuss it. For this project, we utilized the ANEW package in Python, which assigns valence (similar to attractiveness) and arousal (similar to excitement) values to a block of test based on the words used within it. Our analysis primarily focused on valence as an indicator of support or opposition.
We also utilized the collections and re packages to get a list and count of the most common words used in our comments. This allows us to augment the ANEW dictionary with additional words that have particular meaning in this context. For example, when commenters use the word “interfere” it is always in the context of “This law will interfere with my life,” and carries a significant negative connotation. The default ANEW dictionary does not include interfere, but we were able to add it and assign a low valence (indicating opposition). Default ANEW values were derived from a survey of multiple respondents.
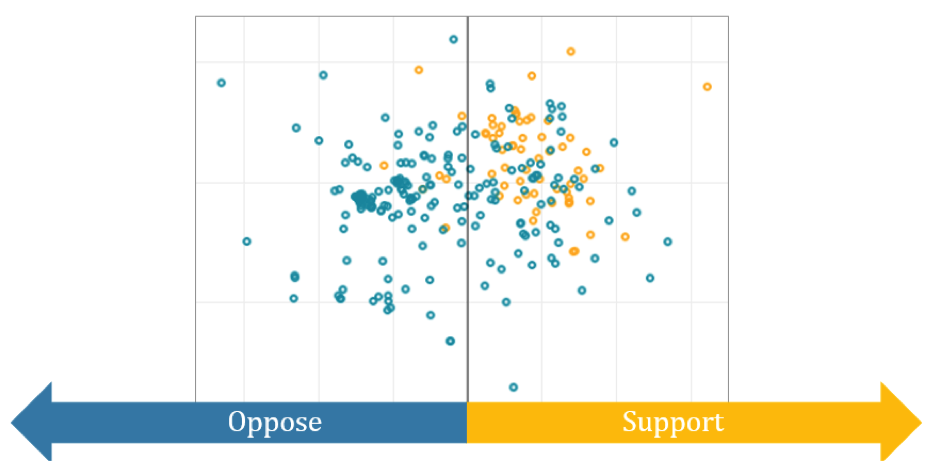
The assigned value for each word is the average response from the survey. The assigned value for each block of text is the weighted average across words. Each word is weighted by the inverse of its standard deviation, diluting the impact of words where more variation in survey responses occurred. In other words, if everyone agreed that “Happy” was a word associated with satisfaction but there was some disagreement on whether “Food” is associated with satisfaction, “Happy” will receive a higher weight in the text block average. Figure 3 represents both the actual and predicted commenter sentiment towards the law. The color of the circle represent actual sentiment and the position from left to right represents predicted sentiment. The distance from top to bottom (the y-axis) represents excitement, which turned out to not be related to accuracy in this case study.

The final step in the sentiment analysis was comparing our predictions to real life (something we call validation in analytics). We had high hopes for the project, but were both floored with the actual results! Our model correctly classified:
- 82.7% of the opposing comments, and
- 88.9% of the supporting comments.
This is more than enough to take the pulse of the populace and required very little human reading.
Columnists: Sarah Gauby and Viola Glenn


