
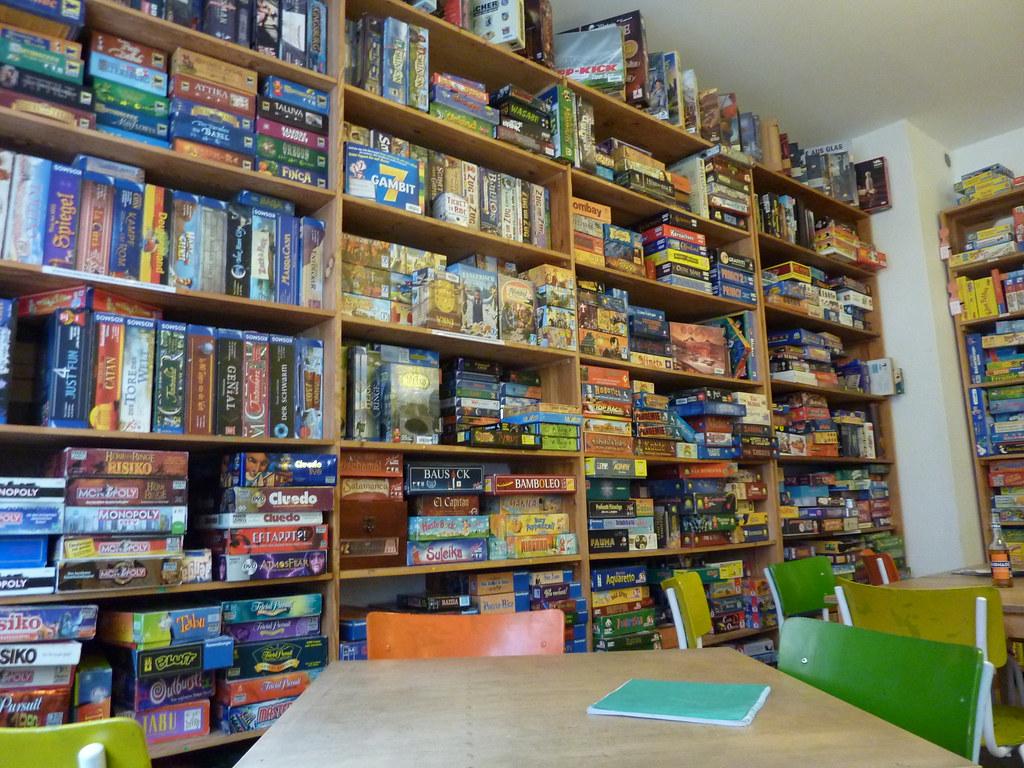
Any board game enthusiast is familiar with this sight. Building a gaming library can be satisfying, but it can be a burden on both your wallet and your shelves. And with thousands of new board games being published each year – many with beautiful art, satisfying components, and exciting themes – it can be difficult to decide which game should be the next addition to your collection.
So which board games are worth buying?
To answer this question, I collected and analyzed data from a small subset of game collections on the popular board game website: BoardGameGeek (BGG). With this data, I calculated a return on investment (ROI) for games, providing a tool to help overcome decision paralysis when selecting a new addition for your bookshelf.
BGG is the internet’s largest repository of board game information, including game descriptions, ratings, prices, reviews, news, and other media. BGG also has a “Collections” system, which allows users to keep track of their personal game collections, record plays, and generate wish lists. Using a combination of web scraping with Selenium and retrieval through BGG’s API, I extracted game prices and user collections to calculate an ROI based on the number of times a game was replayed:

The formula is simple, but collecting high-quality data proved to be a challenge. For example, an obstacle in determining the median number of times a game has been played is that many users do not fully utilize BGG’s Collections feature, and game logging often lacks precision. The dataset used here includes 3,000 collections, limited to users who marked games as “Owned” and logged at least 10 plays total. Additionally, board games are consumer goods and thus have inherent price variability based on condition and vendor. Here I focused on new games from Amazon and Noble Knight Games, which had prices available for over 90% of the games within the dataset, ensuring consistency and minimizing vendor bias. Outliers were reviewed, and the remaining 10% of game prices were manually searched.
After calculating the ROI for games within the dataset, I packaged the results into a simple Tableau dashboard. Here are the top 10 board games based on my ROI metric (minutes played per $ spent):
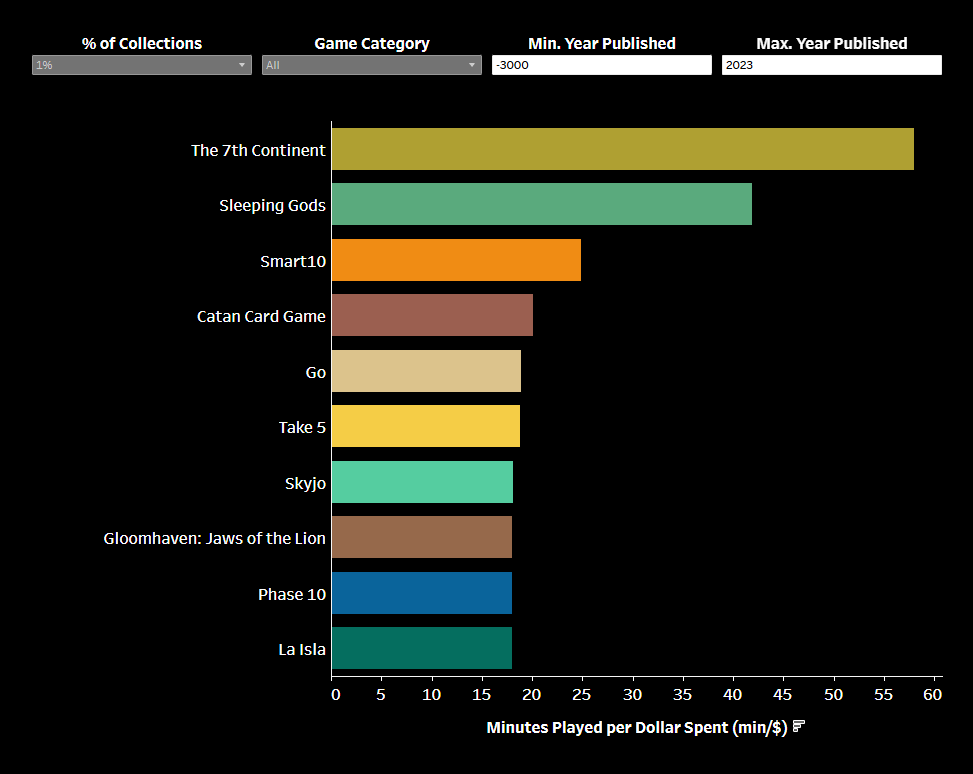
This dashboard includes filters for game categories and publication dates. Additionally, a “popularity filter” was added to display only games present in a certain percentage of user collections, helping to mitigate potential overrepresented games in my limited dataset.
Examining the top 10 games by ROI reveals four distinct groupings, providing insights into which games offer the best investment value:
- Legacy games (e.g., 7th Continent, Sleeping Gods, Gloomhaven: Jaws of the Lion): These lengthy games are played over the course of multiple sessions, often requiring 10-40 hours to complete, naturally achieving a high ROI due to their extensive playtime.
- Casual & family-friendly games (e.g., Smart10, Take5, Skyjo, Phase10): This group includes classic family games and a popular trivia game (with multiple expansions, an unexplored effect that could impact ROI). These games are affordable and are easy to bring to the table, making them a great bang for your buck.
- Classic abstract strategy (e.g., Go): These classic games are timeless for a reason. Their strategic depth, explored in countless books, makes games like Go and Chess endlessly replayable (Note: Chess does not appear in the data because BGG does not define a duration for the game, but it would undoubtedly be in the Top 10).
- Outliers (e.g., Catan Card Game, La Isla): Likely overrepresented games in my small dataset, these inexpensive games highlight the value of the popularity filter (% of Collections) for identifying more mainstream options.
So, what makes a game a good investment? This analysis demonstrates that there are multiple routes: through lengthy campaigns, accessibility for friends and family, or a strategic depth that endures through the ages. You can explore these findings further, filtering for specific categories, publication dates, or popularity with my dashboard here.
While this project has given me some great insights into board games, there are opportunities for improvement. The current approach to identifying active users relies on total play counts, which could be replaced with a stricter metric such as a play rate (plays per month or year). Additionally, the pricing process, which currently includes some manual searching and potential subjectivity, could be enhanced via a more automatic price aggregation with multiple vendors.
Reflecting on this project, I loved getting to blend one of my favorite hobbies with data science, and I found some new games to try out. Now, it’s time to put the analysis aside and dive into playing!
Columnist: Clayton Casper