
I started collecting shoes and engaging with sneaker culture when I was 13 years old. And, while it may not be readily apparent based on my daily footwear at the Institute, I am still an avid sneakerhead. Earlier this month, I decided to spend some of my “free time” looking at some new sneaker releases and prices on StockX, a popular online marketplace for highly desirable shoes and streetwear. After fruitlessly searching for a pair of Jordan 7 Retro Bordeauxs in a size 11.5, I stumbled upon StockX’s 2019 data challenge. StockX called on data enthusiasts everywhere to try to extract any useful information from their sneaker transactions involving Yeezy and Off-White shoes. Both the data nerd and sneakerhead in me were immediately intrigued.
Whether you are a working data analytics professional looking to diversify your project portfolio or a fresh data science hobbyist trying to break into the field, I hope this article cataloging my experience with analyzing sneaker transactions shows you that all you need is a dataset, domain knowledge, and determination to be well on your way to conducting impactful data science.
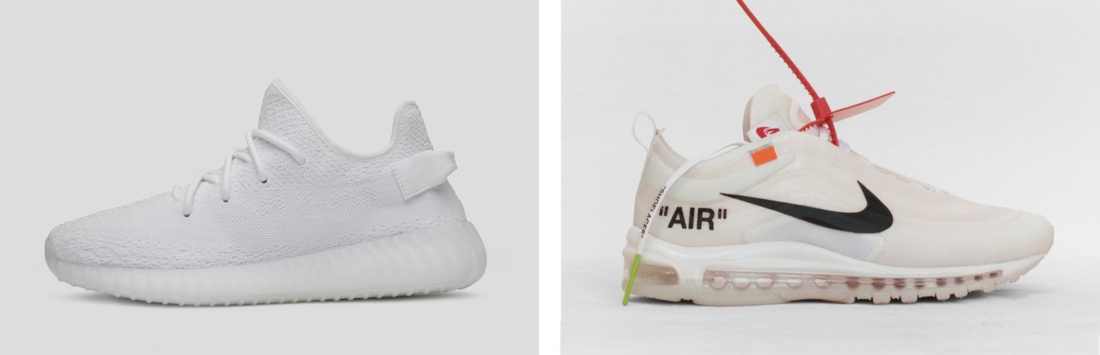
Before I dive into the plots and predictive models, here is a brief overview of the sneaker game. Manufacturers, such as Adidas or Nike, collaborate with famous individuals or luxury brands to create premium shoes with relatively limited supply. News of the impending release (or re-release for older sneakers) reaches the sneaker community and drives up demand. Sneakerheads either line up in front of malls hours in advance or stay on the manufacturer’s website until the exact second of release. The shoes sell out almost instantly. Those lucky enough to snag a pair may elect to resell the sneakers at a profit and purchase even rarer shoes. By analyzing these data, I hope to gain additional insight into the sneaker game. This article will cover a few key highlights of the project, but the entire IPython notebook can be found here.
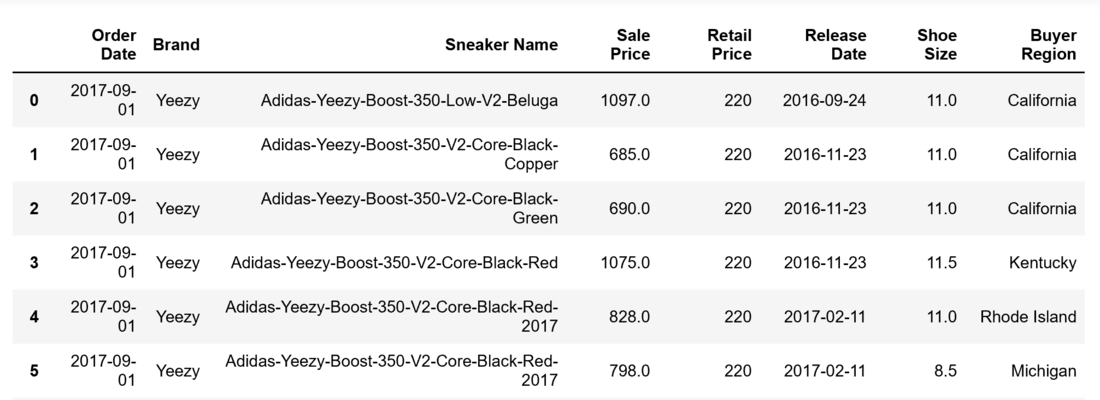
The first step I took with this analysis was to understand the dataset. According to StockX, the data consist of a random sample of all Off-White and Yeezy 350 sales from between 9/1/2017 (the month that Off-White first debuted “The Ten” collection) and 2/15/2019. The sample consists of U.S. sales only. There are 99,956 total sales in the data set: 27,794 are Off-White sales, and 72,162 are Yeezy sales. There are 8 variables included that contain information pertaining to each transaction. This is what the dataset looks like:
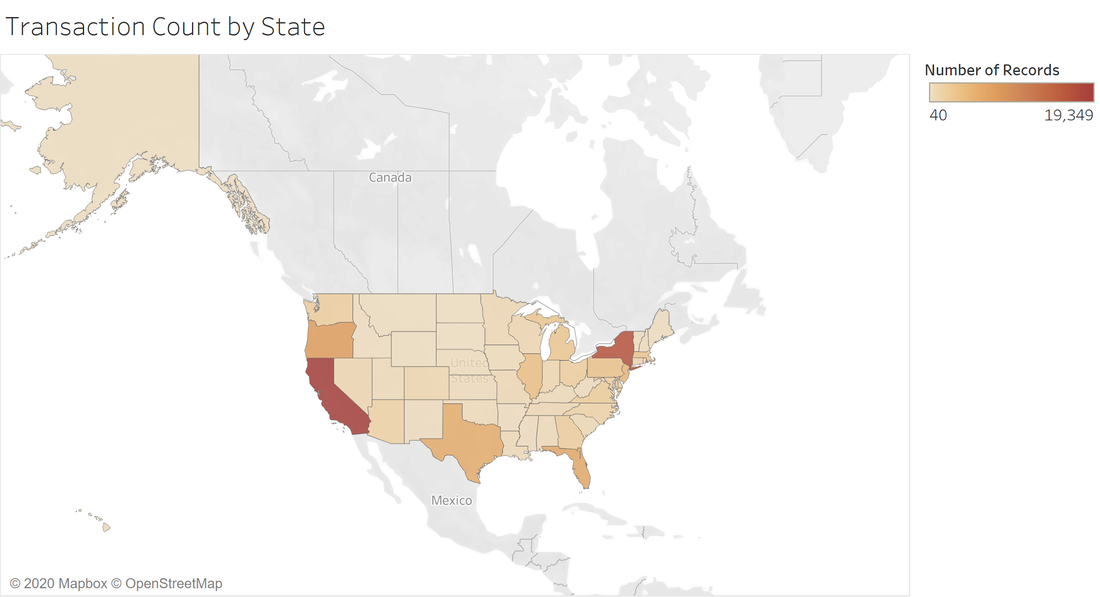
Presented below is a plot of the number of transactions per state. It’s clear from the figure that California and New York make up the largest portion of the data.
In addition to the variables present in the data, I engineered some new features to see if I could extract even more insights. The most interesting are:
- Price Ratio- A ratio of sale price to retail price. This converts sale price from an absolute dollar value to a number that better reflects how much consumers want the shoe. I call this the “hype index”.
- Date Difference- A difference between the Order Date and Release Date. This creates a relative scale for time as opposed to operating on absolute time, making consumer demand for shoes easier to gauge between different models.
The plot below shows average Price Ratio (sale price divided by retail price) over days since release, separated by brand. The orange curve is truncated because Off-Whites are newer (later Release Date) than most Yeezys and therefore have had fewer days since release.
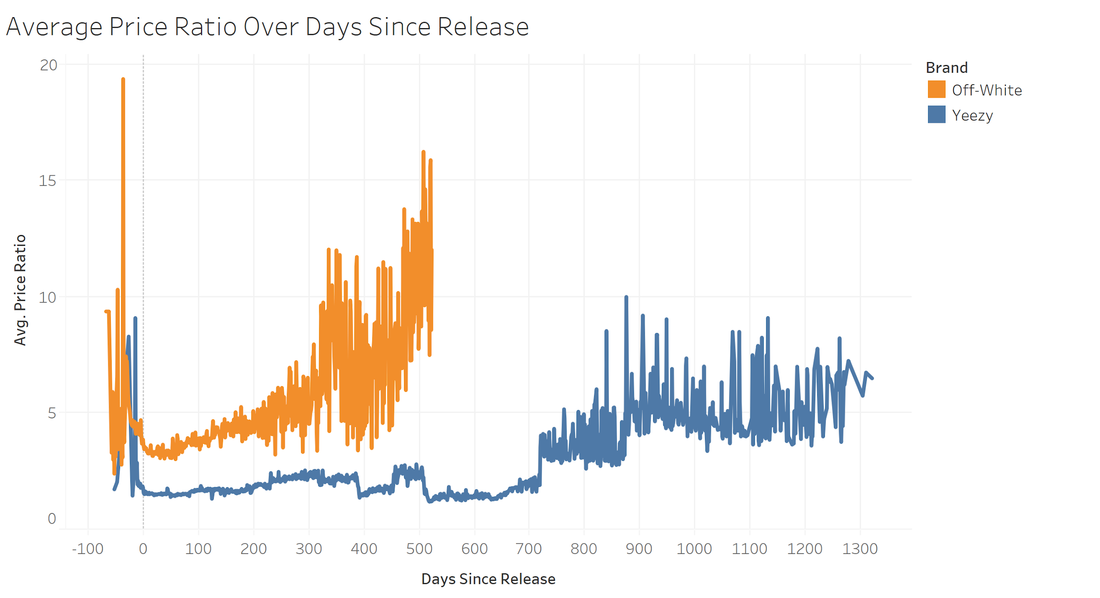
The figure shows that Off-Whites on average sell at higher Price Ratios than Yeezys. Additionally, both Yeezys and Off-Whites have very high Price Ratios during preorder (Date Difference less than 0), and then see relative lows in the first 100 days after release. After the first 100 days, the Average Price Ratio for Off-Whites shoots up, while the Average Price Ratio for Yeezys only goes up slightly until ~700 days after release. From my knowledge of the domain, I hypothesize that this trend occurs because resellers flood the market with deadstock (brand new) pairs and drive down prices. After 100 days post-release, however, it gets harder to find deadstock pairs for any shoe because most resellers have already sold them.
After conducting additional exploratory analysis and feature engineering, I decided to construct models predicting Price Ratio. I chose Price Ratio as the target variable for these models because I believe it best represents the “hype” of a sneaker. Accurate predictions on Price Ratio could also help StockX decide on which sneaker listings to promote to maximize their revenue per transaction. I took two modeling approaches: multiple linear regression and random forest. Prior to all modeling, I created separate training and testing sets. I used Scikit Learn to create these models. All results are shown below:
| Model | Test MAPE |
| Multiple Linear Regression | 24.49% |
| Multiple Linear Regression: log transformed | 22.07% |
| Yeezy Linear Regression | 20.90% |
| Off-White Linear Regression | 16.87% |
| Random Forest: 100 trees, 11 features | 16.91% |
| Yeezy Random Forest: 100 trees, 7 features | 19.10% |
| Off-White Random Forest: 100 trees, 12 features | 11.38% |
The random forest models beat their linear regression counterparts in predictive accuracy. The random forests for the general data and the Off-Whites demonstrated significant gains in accuracy, with reductions in average error of 7.58% and 5.49%, respectively. The Yeezy random forest performed only slightly better than the linear regression, with only a 1.80% reduction in average error in predicting the price ratio.
Through this analysis, I was able to show that Off-White is the more hyped sneaker brand. Additionally, it is possible to model the amount consumers are willing to pay based on certain characteristics of the sneaker involved in the transaction. Most importantly, I applied and improved upon the skills I have learned throughout my time at the MSA.
Columnist: Sameen Salam